 Commercial Real Estate News
Southern California Industrial Market Overview
This 2026, one of the most robust and strategically significant logistical routes in the US is still the Southern California industrial corridor. The area, which includes Orange County, Los Angeles County, and the Inland Empire, is still the main entry point for foreign trade into North America.
The combination of port access, rail connectivity, freeway infrastructure, and dense population centers makes Southern California uniquely positioned for distribution, manufacturing, and supply chain operations.
The current market environment reflects a transition from the extreme landlord-driven conditions of recent years into a more balanced phase that favors thoughtful and strategic decision-making. While vacancy has risen modestly compared to historic lows, it remains within a healthy range for a region with such structural demand drivers. New construction deliveries over the past several cycles added supply, but development activity is beginning to moderate, allowing absorption levels to stabilize and market equilibrium to gradually return.
For companies considering leasing, this environment offers a meaningful opportunity. During the peak of the industrial cycle, tenants faced limited inventory, escalating rents, and minimal negotiating leverage. Today, rent growth has moderated, and landlords are increasingly open to structured concessions, tenant improvement allowances, and more flexible lease terms. This shift allows occupiers to secure high-quality space while preserving capital for core business operations.
Available properties throughout Southern California feature modern specifications tailored to logistics efficiency. Many Class A buildings offer 32- to 40-foot clear heights, ESFR sprinkler systems, dock-high loading, large secured truck courts, ample trailer storage, and proximity to major transportation corridors including the 5, 10, 15, 60, 91, 215, and 405 freeways.
For companies operating in e-commerce, third-party logistics, light manufacturing, food processing, or import/export distribution, leasing provides operational agility without long-term ownership risk.
Sublease availability has also increased in select submarkets, offering cost-conscious tenants the potential to secure space below prevailing market rents. For businesses evaluating near-term growth or temporary expansion, leasing offers the flexibility to scale operations in response to economic cycles and demand fluctuations.
At the same time, purchasing industrial property in Southern California remains strategically compelling for long-term occupiers. Sale pricing has stabilized following cap rate adjustments over recent quarters, bringing improved underwriting clarity to acquisitions. While borrowing costs remain elevated relative to historic lows, pricing transparency allows owner-users to evaluate long-term capital deployment with greater confidence.
Ownership offers distinct advantages. Companies gain control over facility modifications, eliminate exposure to future rent escalation, and strengthen their balance sheets through asset accumulation. In a supply-constrained region where entitled industrial land is limited and development timelines are complex, long-term appreciation potential remains intact. For businesses with operational horizons of five to ten years or more, ownership can provide both financial stability and strategic permanence.
Southern California’s competitive advantage extends beyond individual buildings. The region connects Asia-Pacific trade routes directly to one of the largest consumer populations in the country. Intermodal rail yards, international airports, deepwater ports, and extensive freeway networks create unparalleled distribution efficiency. These logistical advantages are difficult to replicate in secondary markets, reinforcing Southern California’s long-term relevance in global supply chains.
Population density, port throughput, and entrenched industrial clusters continue to drive demand. Even as short-term rent growth moderates, the structural fundamentals remain strong. Businesses seeking proximity to customers, suppliers, and transportation infrastructure consistently prioritize this region due to its speed-to-market advantages.

In conclusion, the current Southern California industrial market represents a strategic window for occupiers. Leasing provides flexibility, negotiating leverage, and capital preservation in a stabilizing environment. Purchasing offers long-term control, balance sheet strength, and participation in one of the most irreplaceable industrial corridors in North America. Companies evaluating expansion, relocation, or consolidation should strongly consider Southern California not simply as a regional option, but as a foundational component of long-term operational strategy.
 Commercial Real Estate News
1st Quarter 2026 Industrial Market – Orange County, CA
After nearly three years of contraction, Orange County’s industrial market showed signs of
stabilization in the fourth quarter. Tenant demand turned positive, ending eleven straight
quarters of negative net absorption. While the county still finished the year with overall negative
absorption, the fourth quarter marks an important shift in momentum.
Vacancy increased to 6.7 percent, up from historic lows but still below the national average.
Even with higher vacancy, Orange County remains one of the most desirable industrial markets
in the country, driven by its proximity to the Ports of Los Angeles and Long Beach and access to
a dense consumer base.
Average asking rents declined modestly, ending the quarter at $1.52 per square foot on a triple-
net basis, about 11 percent below the peak in late 2023. Rent pressure was most noticeable in
West County, while South County continued to command the highest average rents.
North County led the recovery this quarter, posting the strongest net absorption and finishing the
year as the only submarket with positive annual growth. The Airport area also saw solid fourth-
quarter demand, though it remained negative for the year overall.
Leasing activity was highlighted by several large transactions, while investment sales remained
selective but active, led by a major acquisition in the City of Orange. New construction
continued to deliver, particularly in South County, adding to near-term supply.
Looking ahead, economists expect slower job growth over the next two years. Inflation, interest
rates, and broader economic uncertainty remain top concerns, but improving tenant demand
suggests the market may be finding its footing.

If you would like a copy of the report, give me a call at 714-564-7109 or email me at
mark.larson@lee-associates.com
 Commercial Real Estate News
2025 Q4 U.S. Commercial Real Estate & Economic Market Report
Economic Overview
The third quarter of 2025 showed a careful sense of hope for the U.S. economic situation, though expectations stayed modest due to ongoing uncertainties. Signs pointed toward growth, yet challenges remained visible across sectors. Even with constant global tensions and high inflation, a number of signs suggested consistent, though slight, progress. Economic output grew by around 1.8%, somewhat slower than last quarter, yet in line with forecasts considering higher interest rates alongside shifts in global supply chains. Meanwhile, the job market stayed resilient, while unemployment remained near 4.2%; wage growth slowed a bit since businesses slowed job growth to control expenses. Meanwhile, price increases eased slightly to a yearly pace of 3.1%, moving slowly closer to the Fed’s goal.
The Fed kept its tight policy unchanged, holding key rates high in order to keep inflation forecasts stable while hinting at lower rates by early 2026. Consumer spending shifted unevenly; personal outlays dipped as borrowing costs rose, though key sectors—including accommodation, medical services, and trips—stayed stable.
Capital Markets
Investment markets during Q3 showed signs of adjustment. Stock indexes performed with muted volatility following an earlier spike during the year; the S&P 500 closed the period higher by 1.3%, lifted by solid results in tech, industry sectors, and health services. Still, valuations stayed under watch while investors re-evaluated growth forecasts given shifting conditions and sustained monetary tightening. Meanwhile, bond markets gained traction because investors looked for steady returns as markets anticipated looser monetary moves. The 10-year Treasury rate held near 4.35%, a bit below Q2’s high point, with yields in commercial mortgage-backed securities widening. CMBS spreads fell slightly, reflecting stronger trust in credit markets.
Commercial Real Estate Performance
The office market continued its structural adjustment phase, with national vacancy rates rising toward 19.1%. Hybrid setups settled near 2.8 office days weekly, influencing what tenants want—smaller areas and better quality. Industrial real estate performance stayed highest in every sector, where vacancies stood at roughly 4.3%; meanwhile, rent increases slowed, now at 5% compared to last year. Meanwhile, retail keeps improving due to outdoor hubs built around supermarkets and bargain stores, alongside apartment complexes. Factors dipped a bit yet stayed high by past standards, hitting 94% usage with a 3.2% yearly rise in rental costs.
Construction and Development Trends
Rising funding prices, alongside higher supply costs, kept holding back fresh construction launches throughout many industries. Overall building work dropped 14% compared to last year; firms with growing numbers chose partnerships or early sales to reduce uncertainty. Flexible reuse and redevelopment initiatives picked up speed, especially converting offices into homes, backed by local authorities’ support. ESG along with environmental responsibility thoughts on efficiency still shaped funding, as backers focused more on eco-friendly solutions while also valuing lower resource use and low-carbon properties.
Regional Market Highlights
The West region, including Los Angeles and Seattle, experienced moderate leasing activity despite ongoing cost challenges. Manufacturing held steady, whereas commercial space slowed down. In the Midwest, gains were seen as Chicago and Minneapolis strengthened in both industrial and retail basics. The South led growth nationally, with Dallas-Fort Worth and Atlanta showing strong population money flows and building activity continued. In the Northeast, New York and Boston held steady, bifurcated; top-tier assets rose faster than aging standard holdings.
Investment and Financing Environment
Lending terms stayed cautious, as mainstream lenders focused on reduced borrowing with improved coverage levels. Meanwhile, private lenders stepped in where markets lacked fluidity; CMBS issuance increased slightly due to better investor sentiment. Meanwhile, cap rates widened by 25–50 basis points; yet strong properties featuring extended leases stayed sought after. Corporate investors continued to dominate acquisitions in core sectors.
Outlook for Q4 2025 and 2026
Economic conditions should improve steadily as inflation slows down; meanwhile, growth may pick up slightly, though risks remain balanced overall. Interest reductions could happen by early 2026. Meanwhile, industrial properties along with multifamily units are likely to remain leading choices, whereas workplaces keep evolving via flexible redesign. Retail will likely shift toward combined spaces focused on services. However, investors remain cautious about timing and may target high-potential regions with underperforming assets instead of relying on stable returns.
Conclusion
The 2025 Q3 Market Report highlights a shifting real estate scene; though despite ongoing economic challenges, core conditions remain stable. However, investor sentiment remains cautious as participants shift tactics to fit steady rates while adapting their approach accordingly to changing demands from tenants. Lee & Associates highlights using data to guide choices moving forward, with local knowledge together with active oversight of resources. With 2026 near, planning ahead with a shifting focus along with eco-minded funding will shape winning markets.
 Commercial Real Estate News
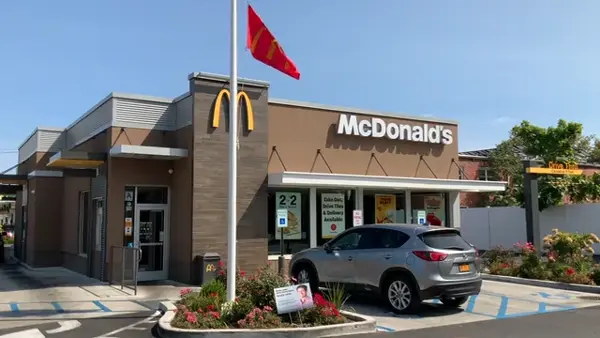
Evaluating Quick-Service Giants: McDonald’s, Taco Bell, and Burger King Through the Lens of Commercial Real Estate
Introduction
For years, fast food places were key to single-tenant net lease investments. The single-tenant net lease world – it’s a pretty straightforward place to put money, bolstered by well-known brands. Sites geared toward quick service – with a focus on drive-throughs – appeal to large investors alongside individuals. Folks putting up money sometimes see big differences between fast food chains – specifically how much return they get. Differences show up in how good the loans are, what the leases look like, and also the property itself.
This report spotlights McDonald’s, Taco Bell, alongside Burger King. The real estate market is ruled by King, yet its value assessments, return rates, alongside costs based on area differ considerably.
McDonald’s
Cap Rates and Pricing
McDonald’s locations sell for the highest prices relative to earnings when compared to similar fast-food chains. This was true going into 2025. By 2025, expect cap rates around 3.96% – though many sales are happening nearer 4.0%. Similar properties have sold for roughly $525 to $675 per square foot; however, a few…
Leasing Land
Leasing land within cities now fetches remarkably better rates.
Building Size and Lease Terms
Typically, McDonald’s restaurants occupy between 3,500 and 4,500 square feet – situated on lots measuring roughly three-quarters to one and a half acres. Land spots boast convenient drive-through access. Agreements usually last two decades – often structured as long-term land leases. A setup where the person using the land – the tenant – holds ownership of anything built on it, yet still owes regular payments for just having the land itself to the actual landowner. It’s a rental situation. Rent hikes aren’t fixed; fresher agreements sometimes include a 10% jump after half a decade, yet others… Initially, previous agreements remain unchanged for ten years.
Credit and Risk Profile
McDonald’s boasts solid financial standing – S&P rates them BBB+, while Moody’s gives a Baa1 score, both indicating reliable creditworthiness. Often, leases come with a company backing them – like a ground lease arrangement – so landlords… Duties won’t overwhelm you. Though ground leases forgo tax advantages like depreciation, boost what remaining property is worth. Alongside solid financial support, this offers a lasting, McDonald’s often costs more because of its real estate deals – specifically, how they lease their land. Typical store prices.
Live Comp Example
A McDonald’s in Middletown, PA was listed on Crexi at a ~4.00% cap with ~3,886 SF. Similar to what’s happening across the country, a separate report by Net Lease Guy indicates roughly 3,919 square feet. Properties are trading near $2.9 million, yielding roughly a 4.06% capitalization rate – which suggests net operating income close to $117,000.
Conclusion on McDonald’s
If you want a safe bet, something unlikely to cause worry, McDonald’s stands out. Evaluating performance reveals a downside – returns are small. They behave similarly to bonds; however, this makes properties particularly appealing to those using 1031 exchanges, likewise investors who focus on… safety.
Taco Bell
Cap Rates and Pricing
Taco Bell lands squarely among fast-food restaurants. Investment returns typically hit around 5.55%, roughly 160 basis points. It yields a bit more than McDonald’s, yet costs more for the space it occupies. Costs shift between $788 and $931. That surprising price – for each square foot – shows the… New fast-food places are getting built smaller, yet cost a fortune to lease – especially those with drive-thru lanes.
Building Size and Lease Terms
Taco Bell restaurants generally occupy between 2,200 to 2,600 square feet, situated on lots ranging from half an acre up to 1.2 acres. They typically lease. Leases generally run for two decades, also offering several chances – at least four – to extend them by another five years. Most leases follow this pattern. Financing relies on promises from franchise owners, not the company itself. Rental costs go up differently each time. Typically, increases happen every five years – often between 5 to 10 percent – though this relies on how well each franchise is doing.
Credit and Risk Profile
Typically, individual Taco Bells operate thanks to franchise agreements. However, Yum! Brands stands behind them. Rated BB+ by S&P alongside a Ba2 from Moody’s – not quite top tier, yet Taco Bell remains a… The concept really shines within Yum! Brands – stores are doing well, so investors feel confident. Back both the name itself alongside how well franchisees are doing, especially those running several locations. Folks tended to trust chains over individual shopkeepers. It felt safer somehow. Consequently, businesses run by larger companies had a reputation for dependability – a feeling independent sellers struggled to match.
Live Comp Example
Net Lease Advisor data shows Taco Bell cap rates holding around 5.5% for new 20-year rental agreements. These properties are frequently priced between $3.2 to $3.5 million. They generally bring in about $180,000 net operating income, which translates to a price per square foot of nearly nine hundred dollars. Mostly brand-new test locations boasting double drive-through lanes, built to… Lots of work gets done quickly.
Conclusion on Taco Bell
Taco Bell delivers more return compared to McDonald’s, yet relies on a familiar idea. People really want these products, yet success hinges on franchisees having good finances. Those wanting to invest should be aware Taco Bell could benefit from investments offering decent returns alongside updated, costly real estate.
Burger King
Cap Rates and Pricing
Compared to the others, Burger King properties are changing hands for the lowest price relative to their income – around 6.38%. Costs run 2.4% more than McDonald’s, meanwhile exceeding Taco Bell’s by 0.8%. Each item… The cost per square foot generally falls between $439–$585, a good deal less than what you’d pay at Taco Bell or… McDonald’s.
Building Size and Lease Terms
Typically, Burger King spots range from 3,000 to 4,000 square feet, sitting on properties that measure between a half acre and up to 1.5 acres. Typically, leases run ten to fifteen years – less time than what Taco Bell or McDonald’s commit to for their land. Rental agreements are a thing. Expect rent hikes – roughly 8 to 10 percent – every half decade.
Credit and Risk Profile
Burger King is owned by Restaurant Brands International (RBI), which carries a BB rating. Originating from ratings below investment quality – think S&P’s lower tiers. Similar to how Taco Bell operates, a majority of Burger King locations aren’t company-owned but leased by franchisees. Assured, yet service depends on who’s running things – some franchise owners really deliver. Strong brands offer security; however, less established locations introduce greater potential for trouble.
Live Comp Example
NetLeaseFinder lists several Burger King NNN properties, typically with 10–15 years of borrowing costs hovering around 6.5%. Net Lease Advisor points out typical property dimensions. Details finalized – the deal confirms a 6.38% return on investment.
Conclusion on Burger King
Burger King offers big potential gains, yet comes with substantial uncertainty. Those comfortable with… Assess how a company’s money situation alongside property values impact profits, considering differences compared to… You might find McDonald’s appealing. Though, for shoppers who prefer sticking to what they know, Burger King could offer more. Didn’t quite hit the safety marks.
Market Backdrop
According to The Boulder Group’s Q2-2025 report, single-tenant net lease cap rates held steady. Generally, we saw a 6.79% rate; stores clocked in at 6.57%, barely a nudge higher – just one basis point. The numbers held steady from one three-month period to the next. Consequently, interest rates didn’t jump around much. The rapid growth seen from 2022 through 2023 has slowed.
Considering everything happening around us: McDonald’s stock, currently at 3.96%, is a bargain compared to typical rates – a pretty secure bet, really. Taco Bell, with a 5.55% rate, seems to be moving toward typical customer levels – however, it remains more focused than most restaurants folks sharing a meal together. Burger King’s 6.38% rate is a touch under what most stores charge, suggesting their prices take that into account. Despite some franchise challenges, quick-service restaurants generally hold steady.
Drivers of the Spread
Credit and Lease Structure
McDonald’s properties boast solid financial backing – think top ratings, commitments from the company itself, yet often involve long-term land agreements. Taco Bell alongside Burger King: Mostly, franchisees back these deals. How much income you get from them changes a lot based on… How well things run, how much stuff sells, whether the money coming in beats the costs – that’s what matters.
Unit Economics and Real Estate
Drive-thru designs now being tested, along with spots on corners or within existing city areas, require more careful size limits. Less reliable companies, aging properties, also trading on secondary exchanges – these factors contribute to larger discrepancies in assessed value. Taco Bell’s newer locations frequently cost more to lease, despite… Even so, they charge more than McDonald’s.
Lease Terms and Escalations
Extended lease lengths, alongside rent increases, offer investors greater security. Think McDonald’s or Taco Bell agreements. Typically, a restaurant sticks around for two decades. However, Burger King spots often have leases lasting just ten to fifteen years.
Key Takeaways
McDonald’s locations offer strong financial standing – good credit, leases where the tenant handles most property responsibilities – but returns aren’t huge, hovering around 4%. A place where traditional shoppers feel secure. Taco Bell delivers decent returns – around 5.5% – operates newer, expensive locations, boasts a solid brand idea. Strong results tempered by dependence on the financial health of franchise owners. Burger King offers potentially bigger returns – around 6 to 6.5 percent – however, investing comes with greater uncertainty because many restaurant owners aren’t considered top-tier financially. Offers assurances, flexible leases, also a range of service providers.
Building a Comp Set
Folks looking at quick-service restaurant investments need to: Gather current property details directly from Crexi, LoopNet, NetLeaseFinder, likewise Ten-X. To find what properties recently sold, tap into services such as CoStar or CompStak. Adjust comparable properties to reflect similar lease terms, rent increases, moreover tenant allowances. Explore how property values shift when rental income or investment return rates change; create charts showing these possibilities. Good comparisons feature top examples – like recent McDonald’s land deals yielding 4%. Comparable stores – like a Taco Bell seeing 5.5% growth – contrast with underperforming ones, such as some aging Burger King locations 6.75%+).
Conclusion
A look at quick service restaurants leased to one owner reveals that a strong name, solid finances, along with… How a lease is set up affects what investors will pay. People still look to McDonald’s as solid, while Taco Bell strikes a chord offering sensible returns alongside up-to-date spaces, while Burger King gets the job done. Greater returns come with greater chances of loss. Considering current single-tenant net lease retail rates hover around 6.6%, these charts show where people put their money depending on how comfortable they are with losing it, also considering… What people earn versus what they require to live.
 Commercial Real Estate News
Negative Leverage Trends in Commercial Real Estate
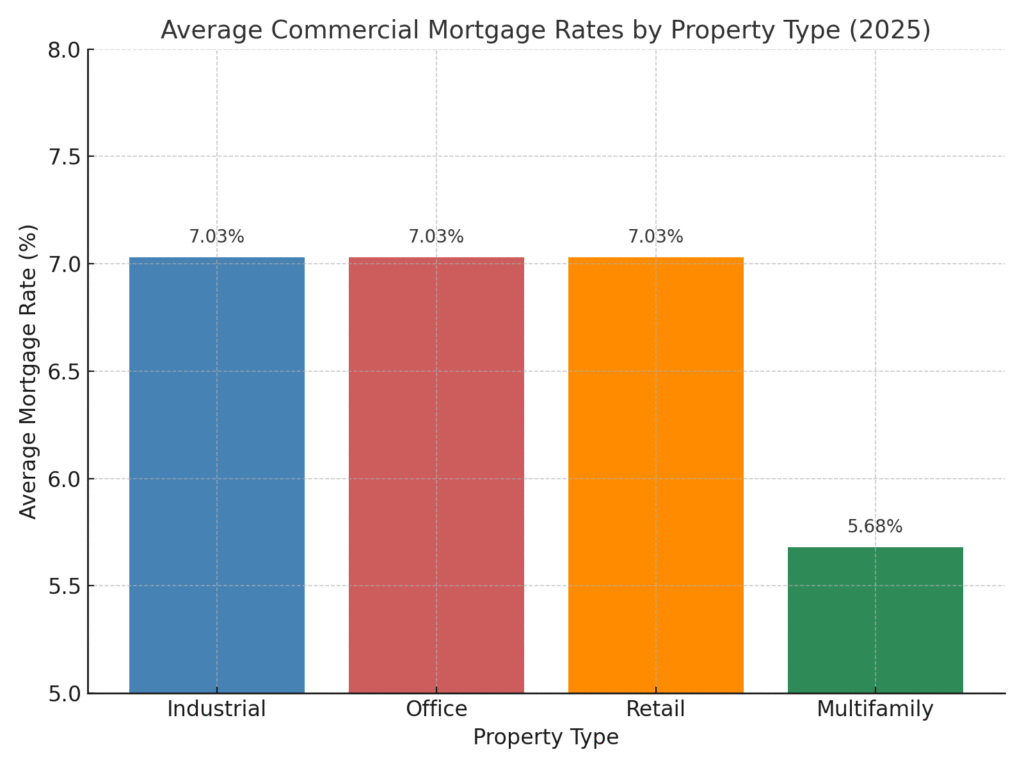
By mid 2025, the commercial real estate (CRE) market is still feeling the weight of higher base interest rates, which have pushed up borrowing costs across nearly every asset class. Whats notable is that capitalization rates haven’t moved upward at the same pace. The result is a shrinking spread between cap rates and interest rates; most evident in the multifamily and industrial segments, two areas that traditionally show strong fundamentals. This tightening has led to more frequent cases of “negative leverage,” where the cost of debt exceeds the return on the asset.
In these conditions, investors lean more heavily on property performance and net operating income (NOI) growth to justify acquisitions, hoping spreads eventually normalize. The challenge is that inflationary pressures remain stubborn, and the market has largely accepted the idea of a “higher-for-longer” rate environment. Unless there are meaningful macroeconomic changes , spreads are unlikely to shift quickly.
Still, data through April 2025 shows the trend may be easing. The share of transactions marked by negative leverage has begun to taper off, hinting at either reduced investor appetite or adjusted pricing expectations. Supporting this , cap rate and interest-rate spread figures show early signs of stabilizing.
Market sentiment has also shifted with expectations for monetary policy. As of June 2025, CME Group data reflects a 65% chance of at least two rate cuts before year-end, a view fueled by weaker GDP forecasts and adjustments in trade policy. If those cuts arrive, they could relieve some of the pressure by lowering financing costs and widening spreads back toward healthier levels.
In short, negative leverage remains a headwind, but there are indications the market is finding its footing. Should monetary easing take place later in 2025, it could mark the start of a more balanced relationship between borrowing and investment returns.
 Commercial Real Estate News
Cracking the Credit Ratings Code: How Moody’s, S&P, Fitch & DBRS Compare
When evaluating the financial stability of companies or governments, credit ratings play a key role. These ratings are assigned by four major credit rating agencies: Moody’s , Standard & Poor’s (S&P), Fitch, and DBRS. Each agency assesses the ability of a borrower to meet their debt obligations and publishes ratings to reflect that assesment for both long-term and short-term debt.
These ratings are generally grouped into categories or “tiers,” ranging from the most reliable known as “Prime” to “In Default” , which indicates a failure to meet obligations. A top-tier rating such as Aaa from Moody’s, AAA from S&P and Fitch, or R-1H from DBRS signals the borrower has a very strong capacity to repay debt.
Beneath the Prime level are other Investment Grade tiers, including High Grade, Upper Medium Grade, and Lower Medium Grade. These categories represent borrowers with solid credit standing and relatively low credit risk.
Anything below Investment Grade falls into Non-Investment Grade, often referred to as “junk” or “speculative” debt. Ratings like Ba (Moody’s) or BB (S&P, Fitch, DBRS) imply higher risk, but also potentially higher returns. As the credit outlook worsens, the ratings descend through Speculative, Substantial Risk, and eventually to Default. The lowest ratings like Ca or C from Moody’s and D from the others indicate serious trouble in repaying debt.
Each agency has its own system:
Moody’s uses a numerical system (e.g., Aa1, Aa2)
S&P and Fitch rely on letter grades with plus/minus signs (e.g., AA+, AA, AA−)
DBRS blends letters with terms like “high” or “low” (e.g., A (high), BBB (low))
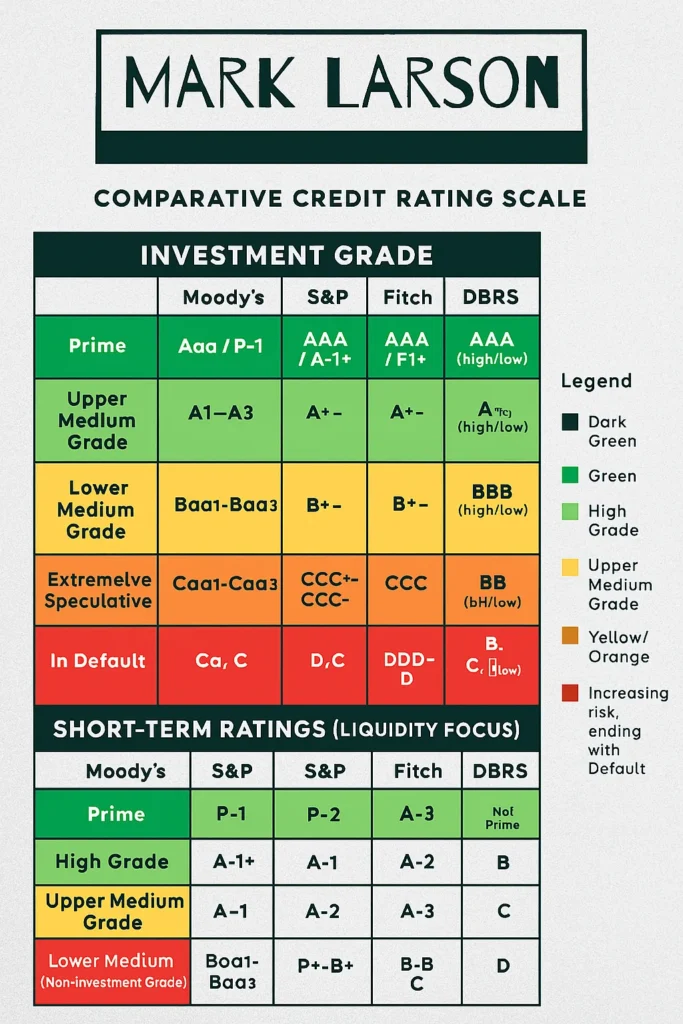
Short-term credit ratings, which assess obligations due within a year, also differ across agencies. For example, Moody’s assigns P-1 to its highest short-term rating, while S&P starts with A-1+ and descends from there.
A comparative table often helps visualize how the agencies’ ratings align. These charts, usually color-coded from green (lowest risk) to red (default), are useful tools for investors, risk managers, and financial analysts who want to gauge the relative risk of bonds or other debt instruments.
Updated 02/06/2026
 Commercial Real Estate News
What the Lee & Associates Brokers See – 2025 Industrial Market Pulse
Overview
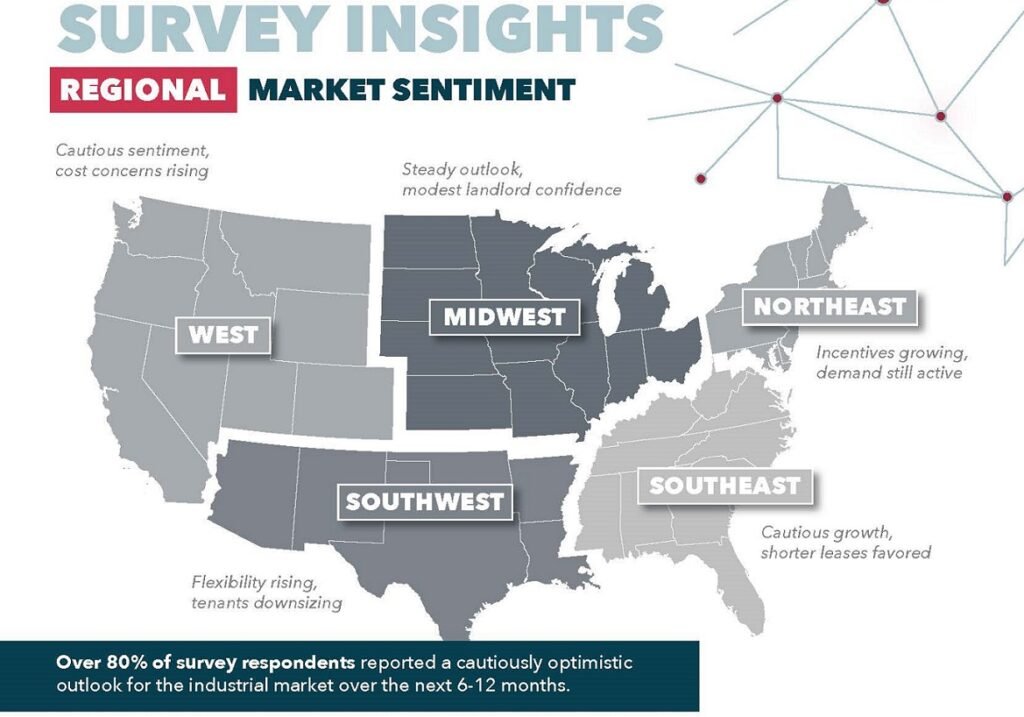
The 2025 Industrial Market Pulse report encapsulates the perspectives of 118 industrial real estate brokers from 47 Lee & Associates offices across the U.S. and Canada. The survey, conducted in May 2025, explores brokers’ outlooks on industrial market trends, tenant behavior, leasing activity, and shifting space requirements. Overall, it portrays a cautiously optimistic yet tenant-driven market environment.
General Market Sentiment
The brokers’ sentiment can be described as “cautiously optimistic.” While economic and political uncertainty ,particularly tariff-related issues, has prompted some tenants to pause major decisions, most brokers still expect stable market performance over the next 6–12 months. A key theme throughout the findings is cost sensitivity, with tenants pushing back against rising lease expenses and expecting more concessions from landlords.
The tenant sentiment, as captured in the report, is cautious and steady. Tenants are generally risk-averse, opting to delay decisions amid uncertainties. This translates into heightened pressure on landlords to remain flexible and competitive.
Leasing and Tenant Trends
One of the most critical takeaways is that the industrial leasing landscape has shifted decisively toward tenants. The size of the space significantly affects market leverage. Tenants with requirements in certain size ranges are encountering more options, enabling them to negotiate for lower rents, improved concessions, and shorter lease terms .
The survey highlights five key shifts in tenant behavior:
- 58.5% of brokers observed a greater sensitivity to rental rates and operating expenses.
- 48.3% reported that tenants now expect more generous tenant improvement (TI) packages and concessions.
- 46.7% noted downsizing and demand for smaller footprints.
- 44.1 % indicated a preference for shorter lease durations
- 24.6% observed increased interest in second-generation or Class B/C spaces at discounted rates.
Lease Rate Outlook
Expectations for lease rate movements are mixed but conservative:
- 34.5% of respondents foresee an increase.
- 31.9% believe rates will stay flat
- 26.7% predict a decline.
- 6.9% consider the market too unpredictable to forecast accurately.
This distribution reinforces the broader narrative of minimal growth or stagnation in lease rates, reflecting the broader caution pervading the market.

Regional Insights
The report also breaks down sentiment by region:
- West: Demand persists, but cost concerns are rising.
- Southwest: Tenants are downsizing, and flexibility is more valued.
- Midwest: Shows a steady outlook with modest confidence among landlords.
- Southeast: Cautious growth with a preference for shorter leases.
- Northeast: Incentives are increasing to keep up with active demand.
These regional nuances highlight localized dynamics but maintain the overarching themes of tenant leverage and landlord concession.
Conclusion
The 2025 Industrial Market Pulse underscores a market navigating cautious optimism tempered by economic uncertainties and tenant-driven dynamics. While brokers remain hopeful about the coming months, they are keenly aware of shifts in power dynamics favoring tenants; prompting landlords to adapt through pricing flexibility, shorter lease structures, and added incentives. This report is not only a snapshot of present conditions but also a guide to navigating the evolving industrial real estate landscape.
 Commercial Real Estate News
Is the Office Dead? Not in Orange County: Why Hybrid Spaces Are Thriving
The narrative around office spaces has shifted dramatically since the pandemic, but in Orange County, the office isn’t dying; it’s evolving. Thanks to hybrid models that balance in-person collaboration with remote flexibility, the region’s commercial real estate is witnessing renewed momentum.
1. A Rebound in Office Demand
Orange County reclaimed nearly 510,000 sq ft of office space in 2024, surpassing pre-pandemic absorption levels—even with a slight dip year-over-year—indicating strong tenant interest in physical office presence. Yet, direct market vacancy stands at around 12%, suggesting ample opportunity for repositioned and high-quality spaces bizjournals.com .
2. Competitive Pricing and Value-Added Incentives
- Avg. asking rent: ~$2.82 FSG per sq ft/month in late 2024.
- Across Orange city proper:
- Class A/A+ spaces around $32.54/sq ft/yr (~$2.71/mo),
- Class B around $24.05/sq ft/yr (~$2.00/mo).
Landlords are sweetening deals with tenant improvements and fit-out funds to attract hybrid-minded tenants, making mid-to-high quality offices highly appealing bizjournals.com.
3. Hybrid Work Driving Demand for Flexible and Collaborative Spaces
Nationwide, 43% of U.S. firms have structured hybrid models, commonly requiring 2–3 in-office days per week, reflecting a middle-ground approach wsj.comtime.com. Local startups and emerging tech firms in OC often choose hybrid-enabled spaces: open workstations, private huddle rooms, wellness zones, and outdoor breakout areas—catering to employees who split time between home and office.
4. Key OC Submarkets Worth Watching
| Submarket | Avg. Asking Rent (FSG/mo) | Vacancy Rate |
|---|---|---|
| Central Orange Market & Airport Area | ~$2.82 | ~12% bizjournals.com |
| St. Joseph Center | ~$2.73 | 16.3% commercialcafe.com |
| Platinum Triangle | ~$2.65 | 19.9% commercialcafe.com |
| Anaheim Resort | ~$2.40 | 25.1% commercialcafe.com |
| City of Orange | ~$1.71 | 6.1% comercialcafe.com |
- City of Orange: Offers budget-friendly Class B/C spaces (~$20.56/sf/year ≈ $1.71/mo) with historically low vacancy—a smart pick for smaller hybrid teams.
- St. Joseph & Platinum Triangle: Slightly higher rents (~$32.81 and $31.80/sf/year) but boast premier locations and modern amenities, appealing to more expressive hybrid setups.
5. Why Hybrid-Ready Offices Win in OC
- Tenant Incentives: Landlords across OC are offering tenant improvement allowances, free rent periods, and flexible lease terms to draw in hybrid teams bizjournals.com.
- Quality Over Quantity: With new construction paused and functional conversions accelerating nationwide, premium spaces stand out—and demand is shifting toward quality adaptive reuse and upgrades nypost.combizjournals.com.
- Tech & Med Sector Surge: Regional demand is boosted by tech and medical tenants in airport-adjacent zones and South OC, filling 80% of sub-10K sq ft deals in recent quarters cbre.comcbre.com.
- Culture Meets Flexibility: Hybrid spaces foster team collaboration and culture in designated “anchor” days, while allowing remote efficiency—perfectly aligning with both business and employee expectations.

What This Means for Your Hybrid Office Strategy
- If you need a cost-effective base (5–20 people), explore Class B/C buildings in Orange city — strong value and low vacancy.
- If you want to shine and recruit talent, look to St. Joseph Center or Platinum Triangle for amenitized Class A spaces.
- Negotiate lease incentives —ask for TI credits, rent-free build-out months, and flexible lease terms to complement your hybrid model.
- Prioritize fit-out for hybrid work: Provide huddle rooms, focus pods, wellness zones, and high-speed conectivity.
Bottom Line
The office is far from dead in Orange County—it’s adapting. Hybrid work demands smarter, more flexible, and more welcoming office environments. With competitive pricing, landlord incentives, and strong tenant demand, OC’s office market offers rich opportunities. Reach out to Mark Larson to find the ideal hybrid space aligned with your team’s evolving rhythm—and take advantage before demand—and pricing; shift again.
 Commercial Real Estate News
Investing in Commercial Real Estate in Fullerton, CA: Why Now Is a Smart Move
Investing in Commercial Real Estate in Fullerton, CA: Why Now Is a Smart Move
If you’ve been considering expanding your investment portfolio, commercial real estate in Fullerton, California presents a compelling opportunity. From retail spaces to mixed-use developments, this dynamic Orange County city offers strong fundamentals for long-term growth and immediate returns.
Why Fullerton?
Located in northern Orange County, Fullerton is more than just a college town. With a population of over 140,000 and home to institutions like California State University, Fullerton (CSUF), the city enjoys a constant flow of traffic, business, and cultural activity.
1. Strong Economic Growth
Fullerton boasts a diversified economy with a healthy mix of education, healthcare, manufacturing, and retail. This economic diversity provides stability for commercial tenants — a key factor for real estate investors.
- Job growth is steady
- Low commercial vacancy rates
- Ongoing city development projects
2. Demand for Retail and Office Space
The revitalization of Downtown Fullerton has sparked demand for retail and mixed-use space. Trendy restaurants, coffee shops, and boutiques attract locals and students alike.
At the same time, flexible office spaces are increasingly attractive to startups and small businesses seeking proximity to Los Angeles without LA prices.
3. Development-Friendly Zoning
The City of Fullerton offers investor-friendly zoning policies, particularly in transit-oriented and mixed-use areas. These allow for adaptive reuse, vertical development, and increased density — ideal for modern investors looking for value-add opportunities.
4. Long-Term Value & Appreciation
Orange County continues to be one of the most competitive markets in Southern California. Fullerton’s affordable entry point relative to nearby cities makes it a strategic location for long-term appreciation.
What Investors Are Saying
“I’ve helped several clients acquire multi-tenant buildings in Fullerton over the past 2 years,” says Mark Larson, local real estate advisor. “With strong tenant retention and city support for commercial development, the ROI potential here is impressive.”
5. Opportunities in Underutilized Properties
Many older properties in Fullerton are ripe for renovation, repurposing, or redevelopment. Investors willing to modernize buildings or convert space can unlock significant equity and rental income potential.
Available Hotspots for Investment
- Retail / Restaurant in Downtown Fullerton – Foot traffic, nightlife, mixed-use buildings – Link -> Freestanding ±3,369 SF retail/restaurant building for sale in Downtown Fullerton – marklarsoncre.com
- Three buildings with strong tenants, parking, and excellent visibility.– Commercial and office zoning – Link -> Industrial/flex property for sale in Fullerton, CA. ±38,646 SF across three buildings with strong tenants, parking, and excellent visibility. – marklarsoncre.com
- Apartment Homes in Fullerton California – SOLD -> Link -> Las Palmas Apartment Homes in Fullerton California – marklarsoncre.com
Final Thoughts
Whether you’re a seasoned investor or exploring your first commercial property, Fullerton offers the perfect mix of stability, growth potential, and community support. If you’re ready to take the next step, reach out today — I’d be happy to show you available listings and opportunities tailored to your goals.
 Commercial Real Estate News
The State of Commercial Real Estate in Orange County: Market Trends & Insights
The State of Commercial Real Estate in Orange County: Market Trends & Insights
Orange County’s commercial real estate market continues to be a dynamic and evolving landscape, shaped by economic trends, shifting business demands, and investor confidence. As a premier location for businesses and commercial investors, Orange County offers unique opportunities across various sectors, including office space, industrial properties, and retail developments.
Current Market Trends
1. Office Space Recovery and Adaptation
The office sector in Orange County has faced significant changes in recent years due to hybrid work models and evolving corporate needs. While demand for traditional office spaces has softened, there is a noticeable shift toward flexible, high-quality work environments that emphasize collaboration and amenities. Areas like Irvine and Newport Beach continue to attract companies looking for premium office spaces with modern layouts and convenient access to transit hubs.
2. Industrial Boom Continues
Industrial real estate remains a hot commodity in Orange County, with high demand from e-commerce, logistics, and manufacturing sectors. The rise of online shopping has fueled the need for distribution centers and warehouse space, driving vacancy rates to record lows. Cities such as Anaheim, Santa Ana, and Costa Mesa have seen a surge in industrial developments, with rental rates climbing steadily due to limited supply.
3. Retail Resilience and Transformation
Despite economic uncertainties, retail real estate in Orange County has shown resilience, particularly in high-traffic and affluent areas. The shift toward experiential retail—such as dining, entertainment, and boutique shopping—has helped brick-and-mortar businesses stay competitive. Popular destinations like South Coast Plaza and Fashion Island continue to draw both local consumers and tourists, ensuring strong leasing activity in premium retail spaces.
Investment Insights
1. High Demand for Mixed-Use Developments
Investors are increasingly looking at mixed-use developments that blend residential, commercial, and entertainment spaces. These projects cater to the growing demand for walkable, live-work-play environments, making them attractive options for developers and investors alike.
2. Rising Interest Rates and Their Impact
With fluctuating interest rates, commercial real estate financing has become more complex. Investors are navigating these changes by seeking creative financing solutions, focusing on value-add properties, and adapting to shifting market conditions.
3. Emerging Submarkets to Watch
While established areas like Irvine and Newport Beach remain prime investment locations, emerging submarkets such as Tustin, Costa Mesa, and Huntington Beach are drawing increased attention. These areas offer lower entry costs while still benefiting from Orange County’s strong economic foundation.
Looking Ahead
As Orange County’s commercial real estate market evolves, staying ahead of trends and understanding key investment strategies will be crucial for success. Whether you are an investor, business owner, or developer, the right market insights can help you navigate opportunities and make informed decisions.
For expert guidance in Orange County’s commercial real estate landscape, reach out to Mark Larson, a seasoned broker with deep market expertise and a commitment to helping clients achieve their real estate goals.